http://www.dial911anddie.com/weblog/200 ... -software/
An example graph looks like
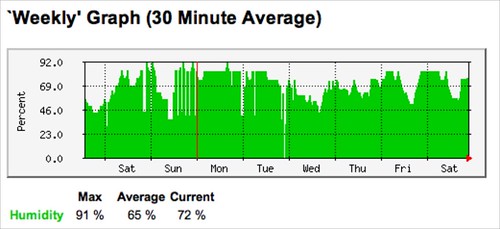
Why are you using MRTG?!?!? It's utterly ancient.Let me start by just ranting about how bad MRTG is. It is unquestionable the worst graphing program I have ever used. No auto scale, can’t to negative numbers, can’t have a y axis that does not start at zero, need I say more. Oh, yah, obtuse and confusing to use.
It sounds like you're familiar with MRTG, do you happen to know if it can do two y-axises? I've been using jpgraph to plot my variables, and it's useful to see temperature and kilowatt usage vs time on the same graph. Another graph I would want to create is real-time energy cost and energy usage versus time.seanadams wrote:Why are you using MRTG?!?!? It's utterly ancient.Let me start by just ranting about how bad MRTG is. It is unquestionable the worst graphing program I have ever used. No auto scale, can’t to negative numbers, can’t have a y axis that does not start at zero, need I say more. Oh, yah, obtuse and confusing to use.
RRDTool is what you should be using for this. Written by the same guy but it is much more powerful, not just in graph presentation features but also in the internals.
Whereas MRTG was made primarily for graphing router interfaces, RRDTool is a totally general package for handling any time-series data. There exist many network monitoring packages built on top of it (eg Cacti, cricket) but all you need here is rrdtool (plus a script to pull data values periodically from indigo and put them in the rrd).
I am very familiar with rrdtool and have used pretty much all of its major features for one thing or another. the last time I used MRTG was 10 years ago but I used to be pretty familiar with it too.jamus wrote: It sounds like you're familiar with MRTG, do you happen to know if it can do two y-axises? I've been using jpgraph to plot my variables, and it's useful to see temperature and kilowatt usage vs time on the same graph. Another graph I would want to create is real-time energy cost and energy usage versus time.
Code: Select all
tell application "IndigoServer"
    set upstairs to temperatures of device "Upstairs Thermostat"
    set downstairs to temperatures of device "Downstairs Thermostat"
    return upstairs & downstairs
end tellCode: Select all
% osascript temp
75.0, 77.0I can't say without a far more thorough explanation of what you're doing, but a common reason for data out to not match data in is that your sampling interval doesn't match the step size of the RRD. This forces interpolation, which gives "correct" but perhaps surprising results.webdeck wrote: When I run it, though, I get temperature values that are exactly four degrees higher than they should be.

Hi Mike,webdeck wrote:While Indigo shows values of 71 and 73 for both thermostats.Code: Select all
% osascript temp
75.0, 77.0
Any ideas?
Code: Select all
[Matt:~/Desktop]: osascript test
73.0, 72.0
Duh, I was running it on the wrong Mac. When I run it on the same Mac as the server, I get the correct values. Thanks!support wrote:Hi Mike,
I'm not sure why you are getting incorrect values. I just tried it and got the correct (same) values shown in Indigo's UI:Do you get the same result if you run the script in the Script Editor? Are you running the script on the same Mac running Indigo Server, or do you have more than one Mac?Code: Select all
[Matt:~/Desktop]: osascript test
73.0, 72.0
Code: Select all
rrdtool create /usr/local/share/logtemp.rrd --step 900 DS:Upstairs:GAUGE:2000:32:120 DS:Downstairs:GAUGE:2000:32:120 RRA:AVERAGE:0.5:1:350400 RRA:AVERAGE:0.5:96:3650 RRA:MIN:0.5:96:3650 RRA:MAX:0.5:96:3650Code: Select all
tell application "IndigoServer"
    set upstairs to temperatures of device "Upstairs Thermostat"
    set downstairs to temperatures of device "Downstairs Thermostat"
    return (upstairs as string) & ":" & (downstairs as string)
end tellCode: Select all
#!/bin/csh -f

set temps = `/usr/bin/osascript /usr/local/share/logtemp.scpt`
/opt/local/bin/rrdtool update /usr/local/share/logtemp.rrd "N:$temps"

/opt/local/bin/rrdtool graph \
		"/Library/Application Support/Perceptive Automation/Indigo 4/IndigoWebServer/images/controls/static/logtemp.png" \
		-a PNG --start "-2days" --width=600 \
		--title="Temperature History Over Last 48 Hours" \
		--vertical-label="Degrees F" \
		'DEF:Upstairs=/usr/local/share/logtemp.rrd:Upstairs:AVERAGE' \
		'DEF:Downstairs=/usr/local/share/logtemp.rrd:Downstairs:AVERAGE' \
		'LINE1:Upstairs#ff0000:Upstairs' \
		'LINE1:Downstairs#0000ff:Downstairs'

exit 0Code: Select all
*/15 * * * * /usr/local/bin/logtemp >/dev/null 2>&1
