Using MRTG to graph indigo data

Discussion of the extending and hacking of the various Indigo components.
cullenfluffyjennings
Posts: 4
Joined: Thu Sep 17, 2009 10:41 am

Using MRTG to graph indigo data

Post by cullenfluffyjennings »

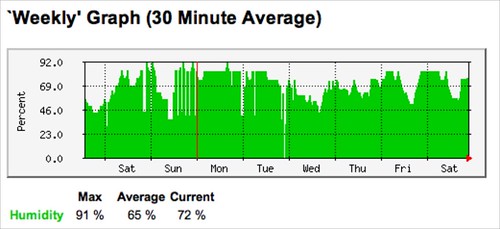
I set up MRTG to make web pages with graphs of data from Indigo (temperature, humidity, when lights were on, etc). There is a brief description on my blog at

http://www.dial911anddie.com/weblog/200 ... -software/

An example graph looks like
Image
seanadams
Posts: 489
Joined: Wed Mar 19, 2008 12:18 am
Location: Saratoga, CA

Post by seanadams »

Let me start by just ranting about how bad MRTG is. It is unquestionable the worst graphing program I have ever used. No auto scale, can’t to negative numbers, can’t have a y axis that does not start at zero, need I say more. Oh, yah, obtuse and confusing to use.
Why are you using MRTG?!?!? It's utterly ancient.

RRDTool is what you should be using for this. Written by the same guy but it is much more powerful, not just in graph presentation features but also in the internals.

Whereas MRTG was made primarily for graphing router interfaces, RRDTool is a totally general package for handling any time-series data. There exist many network monitoring packages built on top of it (eg Cacti, cricket) but all you need here is rrdtool (plus a script to pull data values periodically from indigo and put them in the rrd).
jamus
Posts: 179
Joined: Sat Dec 01, 2007 9:34 am

Post by jamus »

seanadams wrote:
Let me start by just ranting about how bad MRTG is. It is unquestionable the worst graphing program I have ever used. No auto scale, can’t to negative numbers, can’t have a y axis that does not start at zero, need I say more. Oh, yah, obtuse and confusing to use.
Why are you using MRTG?!?!? It's utterly ancient.

RRDTool is what you should be using for this. Written by the same guy but it is much more powerful, not just in graph presentation features but also in the internals.

Whereas MRTG was made primarily for graphing router interfaces, RRDTool is a totally general package for handling any time-series data. There exist many network monitoring packages built on top of it (eg Cacti, cricket) but all you need here is rrdtool (plus a script to pull data values periodically from indigo and put them in the rrd).
It sounds like you're familiar with MRTG, do you happen to know if it can do two y-axises? I've been using jpgraph to plot my variables, and it's useful to see temperature and kilowatt usage vs time on the same graph. Another graph I would want to create is real-time energy cost and energy usage versus time.
seanadams
Posts: 489
Joined: Wed Mar 19, 2008 12:18 am
Location: Saratoga, CA

Post by seanadams »

jamus wrote: It sounds like you're familiar with MRTG, do you happen to know if it can do two y-axises? I've been using jpgraph to plot my variables, and it's useful to see temperature and kilowatt usage vs time on the same graph. Another graph I would want to create is real-time energy cost and energy usage versus time.
I am very familiar with rrdtool and have used pretty much all of its major features for one thing or another. the last time I used MRTG was 10 years ago but I used to be pretty familiar with it too.

In rrdtool you can have a second Y axis although I have not used this to graph totally different quantities as you're describing. It's intended for showing the same quanitity in two different units, eg inches on one side an mm on the other. It should still be possible to do what you want but you'll have to fake it by scaling your second series at graphing time (this can be done using the RPN expression feature).

You really really need to switch to rrdtool it is just awesome for what you're trying to do here. Besides the graphing capabilities, one of the most interesting features for energy monitoring is the "Holt-winters forecasting" feature that is built-in. It is very sophisticated and you could use it to throw alerts when anomalous patterns are detected.

I think there is a hack for mrtg which lets you substitute rrdtool as the database and graph engine. That might be a good way to get your feet wet if you want to keep using mrtg to collect your data, although I'd recommend making a clean break and rolling your own poller script.
webdeck
Posts: 461
Joined: Sat May 07, 2005 11:27 pm

Post by webdeck »

This inspired me to try and make this work using RRDTool. So, I created this applescript:

Code: Select all

tell application "IndigoServer"
    set upstairs to temperatures of device "Upstairs Thermostat"
    set downstairs to temperatures of device "Downstairs Thermostat"
    return upstairs & downstairs
end tell
When I run it, though, I get temperature values that are exactly four degrees higher than they should be. For example:

Code: Select all

% osascript temp
75.0, 77.0
While Indigo shows values of 71 and 73 for both thermostats.

Any ideas?

Thanks,
-Mike
seanadams
Posts: 489
Joined: Wed Mar 19, 2008 12:18 am
Location: Saratoga, CA

Post by seanadams »

webdeck wrote: When I run it, though, I get temperature values that are exactly four degrees higher than they should be.
I can't say without a far more thorough explanation of what you're doing, but a common reason for data out to not match data in is that your sampling interval doesn't match the step size of the RRD. This forces interpolation, which gives "correct" but perhaps surprising results.

I have no idea if that's what's actually happening but it's a common point of confusion.
seanadams
Posts: 489
Joined: Wed Mar 19, 2008 12:18 am
Location: Saratoga, CA

Post by seanadams »

Use this command to see the most recent entries in your rrd:

rrdtool fetch foo.rrd -s end-30minutes AVERAGE
webdeck
Posts: 461
Joined: Sat May 07, 2005 11:27 pm

Post by webdeck »

I'm not using RRDTool yet. All I'm doing so far is running the AppleScript I included above. The values returned by that AppleScript are 4 degrees higher than what the Indigo client displays as the current temperature for each thermostat (so it's not a polling issue between Indigo and the thermostat adapters either, since I'm not looking at what temp the actual thermostats are displaying - I'm comparing directly to what Indigo thinks the temp is.) Indigo says 71, the script returns 75.0.

One of my thermostat adapters and v1 and one is v2, so it isn't a v1 or v2 issue - it's happening with both.

Can anyone else reproduce this issue? Is there an error with my AppleScript code?

Thanks,
-Mike
seanadams
Posts: 489
Joined: Wed Mar 19, 2008 12:18 am
Location: Saratoga, CA

Post by seanadams »

webdeck wrote:I'm not using RRDTool yet. All I'm doing so far is running the AppleScript I included above.
Oh.... sorry, no idea on that one.
User avatar
matt (support)
Site Admin
Posts: 21542
Joined: Mon Jan 27, 2003 1:17 pm
Location: Texas
Contact:

Post by matt (support) »

webdeck wrote:

Code: Select all

% osascript temp
75.0, 77.0
While Indigo shows values of 71 and 73 for both thermostats.

Any ideas?
Hi Mike,

I'm not sure why you are getting incorrect values. I just tried it and got the correct (same) values shown in Indigo's UI:

Code: Select all

[Matt:~/Desktop]: osascript test
73.0, 72.0

Do you get the same result if you run the script in the Script Editor? Are you running the script on the same Mac running Indigo Server, or do you have more than one Mac?
Image
webdeck
Posts: 461
Joined: Sat May 07, 2005 11:27 pm

Post by webdeck »

support wrote:Hi Mike,

I'm not sure why you are getting incorrect values. I just tried it and got the correct (same) values shown in Indigo's UI:

Code: Select all

[Matt:~/Desktop]: osascript test
73.0, 72.0
Do you get the same result if you run the script in the Script Editor? Are you running the script on the same Mac running Indigo Server, or do you have more than one Mac?
Duh, I was running it on the wrong Mac. When I run it on the same Mac as the server, I get the correct values. Thanks!

-Mike
webdeck
Posts: 461
Joined: Sat May 07, 2005 11:27 pm

Got it working!

Post by webdeck »

I got it working with rrdtool. Here is what I did. First, installed rrdtool from macports ("port install rrtool"), then created the database:

Code: Select all

rrdtool create /usr/local/share/logtemp.rrd --step 900 DS:Upstairs:GAUGE:2000:32:120 DS:Downstairs:GAUGE:2000:32:120 RRA:AVERAGE:0.5:1:350400 RRA:AVERAGE:0.5:96:3650 RRA:MIN:0.5:96:3650 RRA:MAX:0.5:96:3650
Created this AppleScript in a text file and saved as /usr/local/share/logtemp.scpt

Code: Select all

tell application "IndigoServer" 
    set upstairs to temperatures of device "Upstairs Thermostat" 
    set downstairs to temperatures of device "Downstairs Thermostat" 
    return (upstairs as string) & ":" & (downstairs as string)
end tell
Created this shell script as /usr/local/bin/logtemp, which grabs the current temps, stores them in the database, then regenerates a graph png image.

Code: Select all

#!/bin/csh -f

set temps = `/usr/bin/osascript /usr/local/share/logtemp.scpt`
/opt/local/bin/rrdtool update /usr/local/share/logtemp.rrd "N:$temps"

/opt/local/bin/rrdtool graph \
		"/Library/Application Support/Perceptive Automation/Indigo 4/IndigoWebServer/images/controls/static/logtemp.png" \
		-a PNG --start "-2days" --width=600 \
		--title="Temperature History Over Last 48 Hours" \
		--vertical-label="Degrees F" \
		'DEF:Upstairs=/usr/local/share/logtemp.rrd:Upstairs:AVERAGE' \
		'DEF:Downstairs=/usr/local/share/logtemp.rrd:Downstairs:AVERAGE' \
		'LINE1:Upstairs#ff0000:Upstairs' \
		'LINE1:Downstairs#0000ff:Downstairs'

exit 0
Added this line to the crontab, to run the script every 15 minutes:

Code: Select all

*/15 * * * * /usr/local/bin/logtemp >/dev/null 2>&1
And added the png graph as a static image on my thermostat control page in Indigo.

When all is done, my thermostat control page looks like this now:

Image

I'm also storing daily averages and min and max in the database, in case I want to create other graphs. I'm storing 10 years worth of 15 minute data, and 10 years of daily average/max/min, just in case I want it later. :)

-Mike
seanadams
Posts: 489
Joined: Wed Mar 19, 2008 12:18 am
Location: Saratoga, CA

Post by seanadams »

That's a nice control page! Maybe I will be inspired to get mine working now...

And isn't it silly that these thermostats only give you 1°F resolution? Same with Aprilaire... tenths would be so much better for graphing.
Post Reply

Return to “Hacking”