I was wondering if anyone had any alternate ideas of how to graph Electrical Energy usage using the Aeon Labs Energy Meter. I have tried several times to get IndigoPlot to work but just can't seem to get it to work. Too many errors and it just isn't easy to use.
Im basically looking for a way to see usages throughout the day and or track energy cost per day or per month. Just seems like this would be a common task people would want.
Any help would be great

Energy Meter Graphs
- Sharek326 offline
-

- Posts: 377
- Joined: Jul 20, 2014
- Location: Lansford, PA
Energy Meter Graphs
- tjm000 offline
- Posts: 60
- Joined: Aug 03, 2008
- Location: Gambrills, MD
Re: Energy Meter Graphs
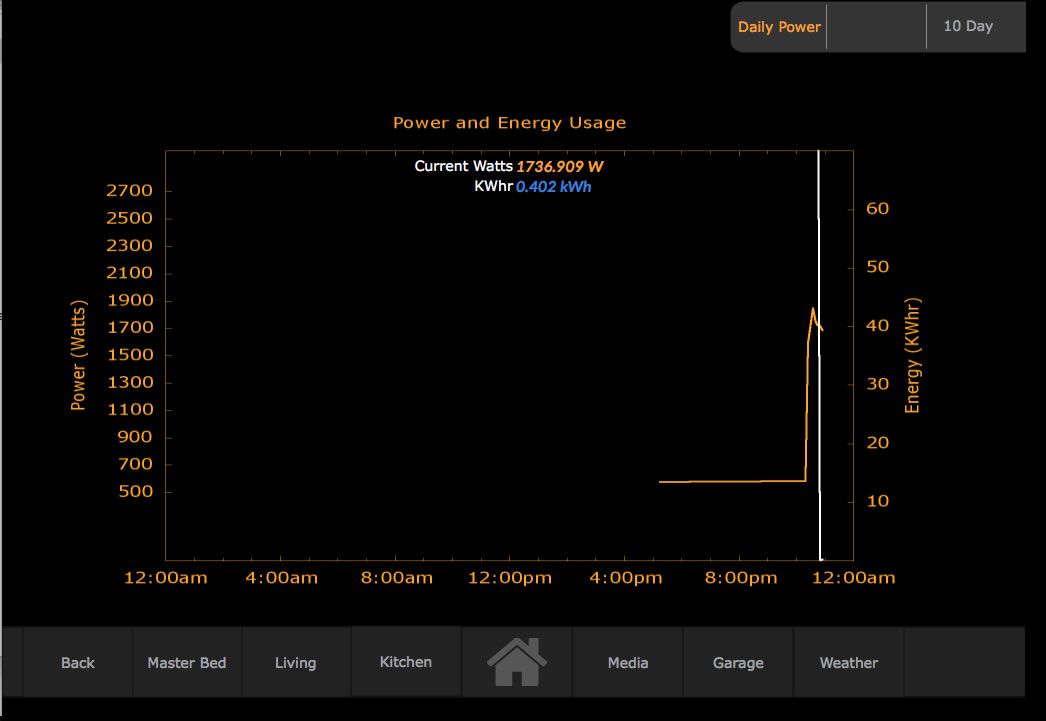
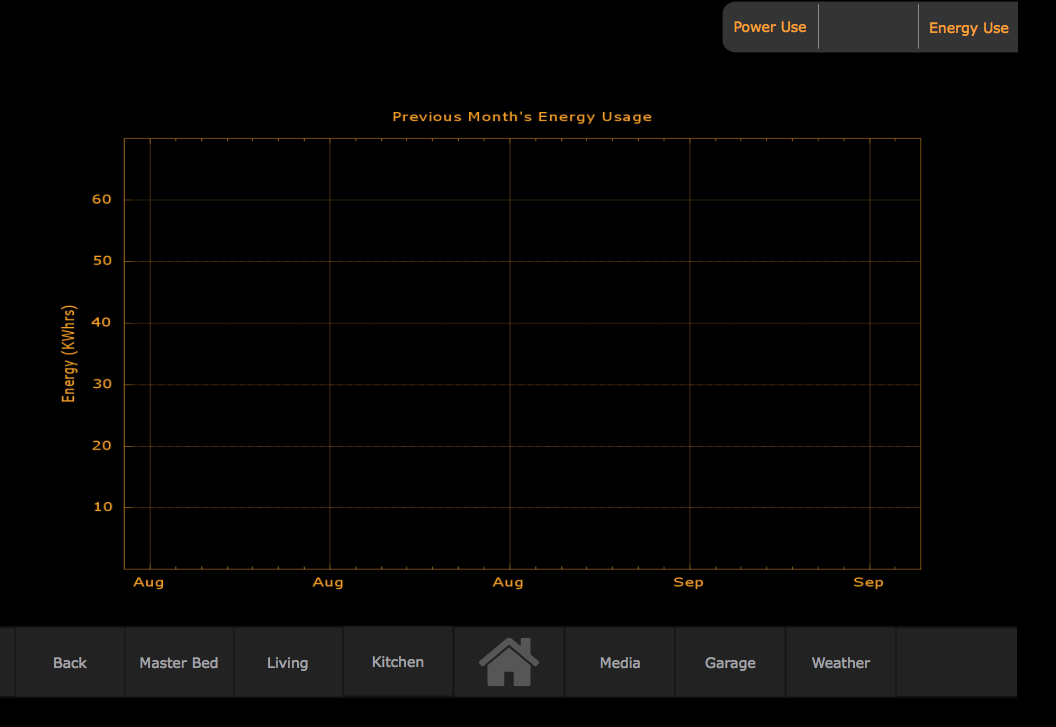
It took me a while also, but I was able to finally figure out how to use INDIGOplotD. If you go to page 33 (late Dec 2015) of Karl's INDIGOplotD you can see the setup that I used for my plots and an example of one of them. Note that I had ran into a small issue with the formatting that I had selected, but Karl quickly fixed the problem once I had pointed it out (which was the reason for my posting). I ended up making three different plots, one for today's current usage with power and energy plotted, one for yesterday's full usage with the same plots, and finally a monthly look back at just the daily total energy usage. I use the Aeon Labs Energy Meter for collecting the data. I have an iPad mounted on the wall where I can examine this data along with other information for my home automation setup. Hope this helps.
- Attachments
-
- IMG_0006.jpg (122.5 KiB) Viewed 4320 times
-
- IMG_0005.jpg (75.68 KiB) Viewed 4320 times
-
- IMG_0004.jpg (70.48 KiB) Viewed 4320 times
Tim
- Sharek326 offline
-
- Posts: 377
- Joined: Jul 20, 2014
- Location: Lansford, PA
Re: Energy Meter Graphs
Fantastic Ill try it tonight
- Different Computers offline
-

- Posts: 2552
- Joined: Jan 02, 2016
- Location: East Coast
Re: Energy Meter Graphs
This is awesome!
SmartThings refugee, so happy to be on Indigo. Monterey on a base M1 Mini w/Harmony Hub, Hue, DomoPad, Dynamic URL, Device Extensions, HomeKitLink, Grafana, Plex, uniFAP, Fantastic Weather, Nanoleaf, LED Simple Effects, Bond Home, Camect.
- yassi offline
- Posts: 468
- Joined: Sep 06, 2015
- Location: Germany
Re: Energy Meter Graphs
Very cool!
May I ask you where you have the icons from and how did you made the grid for them on the left side?
May I ask you where you have the icons from and how did you made the grid for them on the left side?
- Sharek326 offline
-
- Posts: 377
- Joined: Jul 20, 2014
- Location: Lansford, PA
Re: Energy Meter Graphs
I started to build this I had a few questions and some concerns.
In your step 3 you have a var- for yesterday I assume you have that setup as well in your variables but how are you getting a value to it? Are you coping it over at midnight.?
Aside from step three when I save my plot it doesn't generate the PNG files even when i select write file names.
In your step 3 you have a var- for yesterday I assume you have that setup as well in your variables but how are you getting a value to it? Are you coping it over at midnight.?
Aside from step three when I save my plot it doesn't generate the PNG files even when i select write file names.
- kw123 offline
-

- Posts: 8366
- Joined: May 12, 2013
- Location: Dallas, TX
Re: Energy Meter Graphs
Aside from step three when I save my plot it doesn't generate the PNG files even when i select write file names.
Can you create any plot?
if NOT:
1. which plotting engine have you selected (in config)- if gnu plot - you need to install it.. see the pdf file; if matplot - you need to have OS X > 10.6 I believe
2. which plot.png file path have you set (in config) check it there or in ~documents/indigoplotd
3. are there any error messages in the log file.
if YES:
1. have you <CONFIRMed> the plots part 2 and each of the lines in part 3?
2. you could try: <update> & <show> at the bottom
3. you could also try : refresh all plots in the menu.
Karl
- Sharek326 offline
-
- Posts: 377
- Joined: Jul 20, 2014
- Location: Lansford, PA
Re: Energy Meter Graphs
I think i got it working. It wasn't making the PNG files at first and I couldn't get the second line to plot at first but I reset it Meter and it looks ok now

- kw123 offline
-
- Posts: 8366
- Joined: May 12, 2013
- Location: Dallas, TX
Re: Energy Meter Graphs
Do have sqllogger switched on? That should give you more data.
Sent from my iPhone using Tapatalk
Sent from my iPhone using Tapatalk
- kw123 offline
-
- Posts: 8366
- Joined: May 12, 2013
- Location: Dallas, TX
Re: Energy Meter Graphs
Do have sqllogger switched on? That should give you more data.
Sent from my iPhone using Tapatalk
Sent from my iPhone using Tapatalk
- Sharek326 offline
-
- Posts: 377
- Joined: Jul 20, 2014
- Location: Lansford, PA
Re: Energy Meter Graphs
I do now. When I tried to turn it on yesterday I was getting a flood of errors in my event log but now that it is working it seems stable
- kw123 offline
-
- Posts: 8366
- Joined: May 12, 2013
- Location: Dallas, TX
Re: Energy Meter Graphs
you need do do several steps:
-- in indigo menue enable sqllogger
-- THEN in indigoplotd config select / enable which longer you use.
-- THEN in indigoplotd/menu do an import all SQL.
-- in indigo menue enable sqllogger
-- THEN in indigoplotd config select / enable which longer you use.
-- THEN in indigoplotd/menu do an import all SQL.
- Sharek326 offline
-
- Posts: 377
- Joined: Jul 20, 2014
- Location: Lansford, PA
Re: Energy Meter Graphs
Great!.....I never knew you had to do all those extra steps.....no wonder it was failing for me. Now that I got power usage Today working my next goal is to get the same thing for yesterday so I can compare and then I would love to have a monthly recap screen. Any suggestions how they can be pulled off?
- Sharek326 offline
-
- Posts: 377
- Joined: Jul 20, 2014
- Location: Lansford, PA
Re: Energy Meter Graphs
To capture Energy over the month I am trying to copy what another user has done,,,,or at least I think I am
At 11:59 PM I have the Device dump current KWhr into a EnergyYesterday Variable I am then attempting to pull the data but the plot is not populating anything
At 11:59 PM I have the Device dump current KWhr into a EnergyYesterday Variable I am then attempting to pull the data but the plot is not populating anything

- johnpolasek offline
- Posts: 911
- Joined: Aug 05, 2011
- Location: Aggieland, Texas
Re: Energy Meter Graphs
The plot can only go back to the point when you first enabled SQL... That's when the data source became available (and the reason for the SQL plugin in the first place; by default, Indigo doesn't keep any history except for the log files). Off topic, but a trip down memory lane, back in the days before the SQL plugin, I had an applescript that formatted all my weather data into a comma separated line of text and appended it to a CSV file once a minute... and then I had to use Excel to read the file and plot the information... SQL and IndigoPlot is a LOT easier.
Who is online
Users browsing this forum: No registered users and 12 guests