I know this reply is late, but I am doing something similar with my TED energy monitor. Very high level, this is what I am doing:
FOR DAILY USAGE1. I have a schedule to run every 1 second that queries the energy usage and writes this value to a variable
(temp_running_usage)2. I have another schedule that runs every 1 second that takes that variable, divides by 3600, and writes that to another variable (
true_running_usage)
3. I have another schedule that resets both variables at Midnight
4. I have Grafana look at the
true_running_usage variable
FOR DAILY COST1. First I have a variable that is our electricity rate. Since we are on Time of Use, I have a schedules that update that rate at the appropriate times and dates (
current_rate)
2. I then have a schedule that runs every 1 second that takes the
true_running_usage variable above and multiplies it by the
current_rate, and writes this to another variable (
current_cost)
3. I have Grafana look at the
current_cost variable
I found it important to have all the values use at least 4 digits on the right of the decimal to keep things accurate.
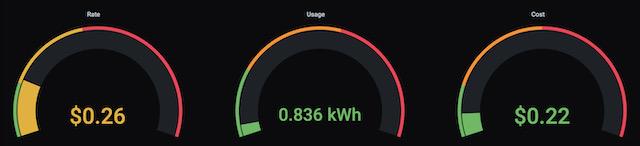
I attached a few Grafana dashboard & config screenshots. I also have a near real time dashboard for my phone which I have included.
I can share all the Python that lives in the different schedules, and appropriate screenshots if you like.

- Screen Shot 2021-01-05 at 6.54.00 PM.jpeg (180.54 KiB) Viewed 4868 times
- Screen Shot 2021-01-05 at 7.46.34 PM.jpeg (54.6 KiB) Viewed 4868 times

- IMG_1517 (1).jpeg (60.83 KiB) Viewed 4868 times

- Screen Shot 2021-01-05 at 6.54.41 PM.jpeg (165.32 KiB) Viewed 4868 times

- Screen Shot 2021-01-05 at 6.54.20 PM.jpeg (180.99 KiB) Viewed 4868 times