Glad to hear that you're making progress! Here's a shot of my configuration for my every day Indigo Server:
- Screen Shot 2019-03-14 at 9.19.00 AM.png (69.22 KiB) Viewed 3099 times
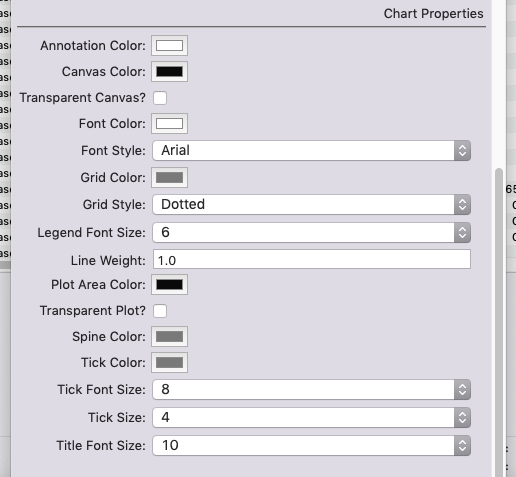
You'll notice that I'm heavy on whites, grays and blacks. I prefer a "dark mode" for my control pages.
Also, have a look at the plugin wiki which may help with understanding the plugin. There isn't any detail on the individual settings--that's on the TO DO list.
Wiki HomeA few pointers:
Annotation color: the color of the text within the chart that shows the value of the data points
Canvas color: the background color of the chart
Transparent canvas: ticking this box will let the background color of your control page show through.
Font color: the color of text (except the annotations.)
Grid color: the color of the grid lines within the plot area.
Plot area color: the color of the background within the plot area itself.
Spine color: the color of the four lines that bound the plot area.
Tick color: the color of the tick marks along the axes.
Note that when you change a color of one of these elements, you have to wait for the charts to be regenerated. This will happen at the next scheduled refresh interval. Alternatively, you can choose to regenerate them instantly by selecting the "Redraw Charts Now" menu item from the plugin menu.
Lastly, I've found that Safari doesn't always recognize that the image files have been updated--especially if you make several refreshes in quick succession. It's best to look at the image files in Finder to see if the changes have been applied.


